|
|
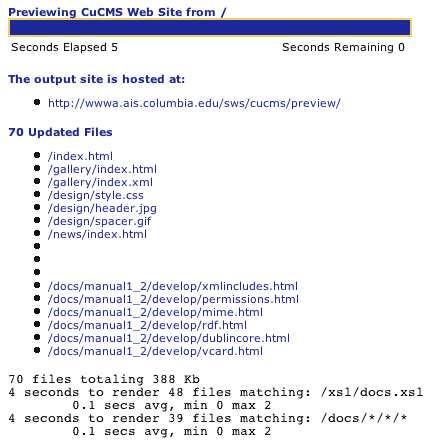
The report screen is launched in separate window from the portal any time a complex action is requested by the user, including preview, build, publish, compact revisions, rebuild search index, download or upload zip.
While the action is in progress, only the status bar will appear, giving you both a visual cue and estimate in seconds of how long the action will take to complete.

The stop sign icon on the right allows you to gracefully stop the action in progress; a build or publish command that is stopped will easily be picked up by re-issuing the command, as only files that are not up-to-date are changed in a normal build or publish request. Most requests are composed of many smaller activites, such as building an individual file; the currently active "small" process is allowed to complete normally before the overall request is stopped; only in the case where that small process exceeds a 10 second timeout will it be killed prematurely.
Once the action is completed, sections below the status bar will show you
- where the output is located (if any)
- what files were updated
- what files were deleted
- what errors occured
- any metrics compiled during the request

Metrics
Each request may have a different set of metrics associated with it, or none at all. For example, a compacting request reports how many old revisions were removed. A rebuild index request reports how many files were indexed.
Preview, build and publish requests have a set of metrics designed to help you identify potential implementation bottlenecks in you site, including
- How many files were processed
- The total number of kilobytes output
- total, minimum, maximum and average processing times for files associated with a particular XSL stylesheet, or with a particular document types (identified by the pattern associated with that type)
Note that the processing times will not add up to the total seconds elapsed as indicated at the top of the report: various metrics will overlap, since each metric aggregates times according to different but not mutually exclusive criteria. In order to highlight the most important data, a rendering request only displays metrics whose aggregate time exceeds 1 second.
|
|  |


